Elevator Waiting Time vs Time to Destination: Lift KPIs Decoded
papi
Updated on
Elevator waiting time and time to destination are the two KPIs quoted more than any others, and they are routinely confused. Elevator waiting time is what a passenger spends in the lobby; time to destination is the whole journey, lobby to desk. Treating them as interchangeable leads to designs that look fine on one number and disappoint on the other. Here is the distinction and why it matters.
Elevator waiting time: the lobby experience
Elevator waiting time, often abbreviated AWT, is the mean time a passenger waits from registering a call to a car arriving and opening its doors. It measures the lobby experience, the visible queue, and it is the figure occupants complain about first because it is the part of the trip they spend standing still.
In a conventional up-peak, elevator waiting time runs at a little over half the interval, because a passenger arriving at a random point in the dispatch cycle waits, on average, part of one interval. For a good office, a waiting time below 20 to 25 seconds at the up-peak is a common target.
Time to destination: the whole journey
Time to destination, sometimes called transit time or journey time, is the complete duration from registering a call to arriving at the destination floor. It includes the wait, the boarding, every intermediate stop, and the ride itself. It measures what the passenger actually cares about, how long it takes to get where they are going, not just how long they queue.
The two KPIs diverge as buildings get taller. In a low-rise building, the ride is short, so this metric dominates the journey and the two figures track closely. In a tall building, the in-car time, intermediate stops and the long travel can dwarf the wait, so a building with an excellent wait can still have a poor time to destination if cars stop too often or travel too slowly.
Why the distinction governs design decisions
The two metrics point to different fixes. A poor waiting time is a dispatch and frequency problem, solved by more cars, better control or shorter intervals. A poor time to destination, with an acceptable wait, is a journey problem, solved by faster cars, fewer stops per trip through zoning, or express runs to upper floors.
This is why tall-building design leans on zoning and sky lobbies. Splitting the building into zones served by dedicated lift groups cuts the number of stops each car makes, which shortens time to destination even though it does little for the wait. A designer who optimizes only for waiting time will under-serve a tall building’s journey time, and the occupants on the top floors will feel it every trip.
How both are measured properly
This metric can be estimated from interval in a simple calculation, but time to destination is harder to compute by hand because it depends on how many stops each car actually makes, which varies with the random pattern of destinations. Simulation is the reliable way to measure both, because it tracks every passenger’s complete journey, recording the wait and the full transit separately.
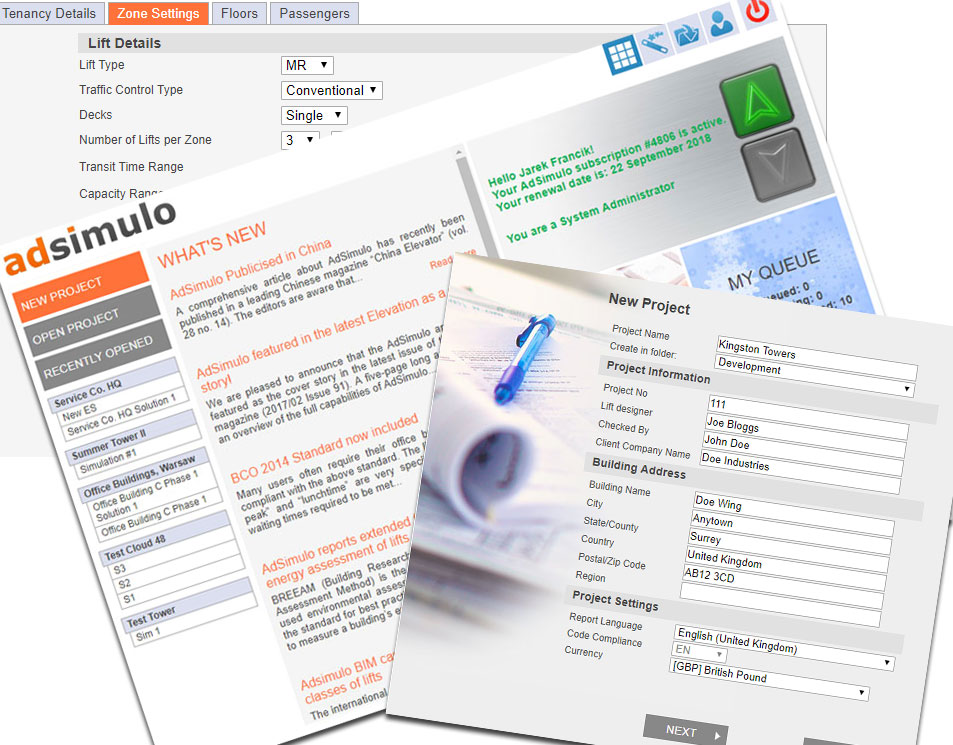
AdSimulo reports both KPIs from the same simulation. Because it models each passenger individually, it captures the wait and the end-to-end journey for every person and reports the distribution, not just the average. Its sky-lobby modeling links each passenger’s journey across a transfer, including the wait to change cars, so the time to destination in a shuttle-and-local arrangement reflects the real end-to-end experience rather than an idealized estimate.
Reading the two together
A complete service picture needs both numbers. The waiting time alone hides long journeys in tall buildings; time to destination alone hides a poor lobby experience behind a decent overall trip. The discipline is to set targets for both, appropriate to the building height and grade, and to confirm the design meets both before signing it off. AdSimulo’s executive scorecard grades the design against the service targets you set, so a shortfall on either KPI is flagged rather than buried.
Where the definitions come from
The formal definitions of these KPIs and the recommended targets sit in CIBSE Guide D, the UK reference for transportation systems in buildings, available through the CIBSE knowledge portal. Using the standard definitions matters, because waiting time and journey time are easy to define loosely, and a client comparing two consultants’ reports needs them measured the same way.
What to do next
Set separate targets for this metric and time to destination, lean on the latter for tall buildings, and measure both with simulation so neither hides a weakness in the other. To report both KPIs from a single set of runs, see the lift traffic analysis workflow.
Is elevator waiting time the same as time to destination?
No. The wait is only the lobby wait; time to destination is the complete journey including the wait, boarding, intermediate stops and the ride. They track closely in low-rise buildings and diverge sharply in tall ones.
Which KPI matters more?
It depends on the building. In low-rise buildings, the waiting time dominates the experience. In tall buildings, time to destination matters more because the ride and intermediate stops can outweigh the wait. Good design sets targets for both.
How is time to destination reduced?
By cutting the number of stops per journey and the travel time: faster cars, zoning so each car serves fewer floors, and express runs or sky lobbies in tall buildings. These help journey time even when the wait is already good.
Can these KPIs be calculated by hand?
Waiting time can be estimated from interval, but time to destination depends on the random pattern of stops and is reliably found only through simulation, which tracks each passenger’s full journey.
We use cookies to improve your experience on our site. By using our site, you consent to cookies.
Cookie Preferences
Manage your cookie preferences below:
Essential cookies enable basic functions and are necessary for the proper function of the website.
Name
Description
Duration
Cookie Preferences
This cookie is used to store the user's cookie consent preferences.
30 days
Cookie Preferences
This cookie is used to store the user's cookie consent preferences.
30 days
Google reCAPTCHA helps protect websites from spam and abuse by verifying user interactions through challenges.
Name
Description
Duration
_GRECAPTCHA
Google reCAPTCHA sets a necessary cookie (_GRECAPTCHA) when executed for the purpose of providing its risk analysis.
179 days
Google Tag Manager simplifies the management of marketing tags on your website without code changes.
Name
Description
Duration
td
Registers statistical data on users' behaviour on the website. Used for internal analytics by the website operator.
session
cookiePreferences
Registers cookie preferences of a user
2 years
Statistics cookies collect information anonymously. This information helps us understand how visitors use our website.
SourceBuster is used by WooCommerce for order attribution based on user source.
Name
Description
Duration
sbjs_session
The number of page views in this session and the current page path
30 minutes
sbjs_udata
Information about the visitor’s user agent, such as IP, the browser, and the device type
session
sbjs_first
Traffic origin information for the visitor’s first visit to your store (only applicable if the visitor returns before the session expires)
session
sbjs_current
Traffic origin information for the visitor’s current visit to your store
session
sbjs_first_add
Timestamp, referring URL, and entry page for your visitor’s first visit to your store (only applicable if the visitor returns before the session expires)
session
sbjs_current_add
Timestamp, referring URL, and entry page for your visitor’s current visit to your store
session
sbjs_migrations
Technical data to help with migrations between different versions of the tracking feature
session
Marketing cookies are used to follow visitors to websites. The intention is to show ads that are relevant and engaging to the individual user.
Facebook Pixel is a web analytics service that tracks and reports website traffic.