When a building opens with too few lifts, the cost shows up every weekday morning. Tenants queue in the lobby, the managing agent fields complaints, and retrofitting a new shaft into a finished core can run into seven figures. Lift traffic analysis exists to stop that outcome before a single beam is cast.
This guide answers: what is lift traffic analysis, the metrics it produces, the methods used to calculate them, and how modern software replaces a week of spreadsheet work with a single set of runs. If you design buildings, specify their services or manage them once they are occupied, this is the discipline that decides whether the vertical transportation works.
What lift traffic analysis actually measures
Lift traffic analysis is the process of predicting how passengers will move vertically through a building and testing whether a proposed lift installation can carry that demand to an acceptable standard of service. It answers three questions a developer cares about: how many lifts, how big, and how fast.
The analysis models a population of people arriving, requesting floors and being served by a group of lifts over a defined period, usually the busiest five minutes of the day. From that model it reports a small set of numbers that together describe quality of service.
The headline metrics are:
Average waiting time (AWT) — the mean time a passenger waits from registering a call to a car arriving. This is the number most occupants notice.
Handling capacity — the percentage of the building population a lift group can move in five minutes, written as %POP.
Interval — the average time between car departures from the main terminal, the classic measure of how often a lift turns up.
Time to destination — the full journey time including the in-car ride, which matters most in tall buildings.
A design is judged against target values for these figures. A prestige office tower might aim for an interval under 25 seconds and an average waiting time under 20 seconds; a budget residential block can tolerate more.
Why guesswork is expensive
Lift cores are fixed early and changed late. The number and size of shafts is locked in during concept design, long before anyone counts the actual occupants. Get the demand profile wrong and there are only bad options: accept poor service, sacrifice lettable floor area to a wider core, or pay for a structural alteration that nobody budgeted.
This is why the analysis happens before the design is frozen. By simulating the morning up-peak against the real population, you find out whether four lifts are genuinely enough, or whether the building needs five, while it is still cheap to add one on paper.
The two methods: calculation and simulation
There are two established ways to produce the numbers.
Calculation
The traditional method computes round trip time, the average time for one lift to complete a full cycle up and back, using the building’s floor count, population, car capacity and speed. From round trip time you derive interval and handling capacity with a set of equations refined over decades and codified in standards such as CIBSE Guide D. Calculation is fast and transparent, and for a simple up-peak in a standard office it remains a sound first pass.
Simulation
Calculation assumes idealised conditions: passengers arrive at a steady rate and lifts behave predictably. Real buildings are messier. People arrive in clusters, traffic flows in two directions at once, and modern dispatch algorithms make decisions that no closed-form equation captures.
Simulation models each passenger and each car as individual agents over time. It generates thousands of randomised arrivals, runs the actual dispatch logic, and records what every passenger experiences. The result reflects how the building will really behave, including the awkward mixed-traffic periods that calculation glosses over. For destination-dispatch systems, sky lobbies and mixed-use buildings, simulation is the only method that gives a trustworthy answer.
A worked sense of scale
Consider a 15-storey office with 1,200 occupants and four lifts. A calculation might show handling capacity of 11% and an interval of 30 seconds during the up-peak. Against a target of 12% and 26 seconds, the design falls short. The analysis tells you this in minutes, and lets you test the fix, a faster lift, a larger car, or a fifth shaft, before committing.
That is the entire value of the exercise: every change is tested in software, where it costs nothing, instead of on site, where it costs everything.
How software changed the work
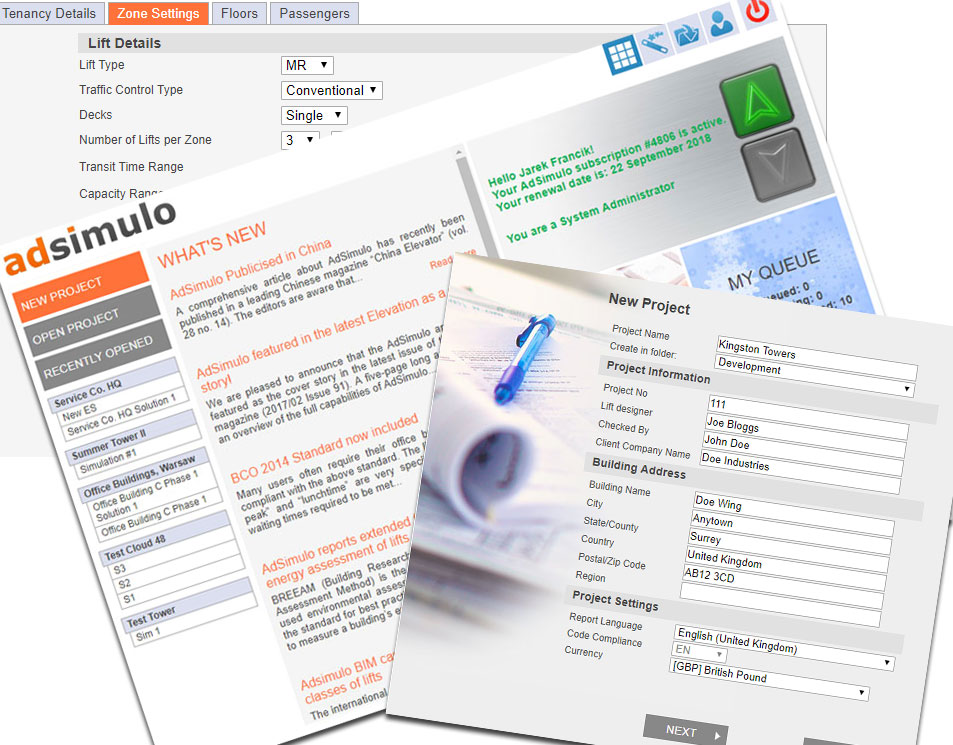
For years this analysis meant bespoke spreadsheets and desktop tools that took specialist knowledge to drive. AdSimulo was built to remove that barrier. You set the building’s tenancy type, floor count and population, and its Expert System runs thousands of simulations to return the lift configuration that meets your target level of service, automatically, rather than leaving you to iterate by hand.
The consultants who have switched describe the difference in productivity rather than features. One chairman of a lift consultancy put it plainly after moving across: he would not be going back to his old desktop tool because the newer approach made his team far more productive. That is the practical effect of automating the search for a working design instead of testing options one at a time.
The software also produces the evidence. Twenty-three report types cover waiting times, handling capacity and journey times in a format ready to send to a client, and a 3D visualisation lets you watch passengers and cars move through the building during the up-peak so a queue or a bunched pair of cars is obvious at a glance.
Where the standards sit
Lift traffic design in the UK is governed primarily by CIBSE Guide D, the reference that defines the calculation methods, recommended service criteria and population assumptions the industry works to. You can find the official scope of that guidance through the CIBSE publications library. Anyone producing traffic analysis professionally should treat Guide D as the baseline against which their figures are read.
What to do next
If you are sizing a building, start by establishing the population and the tenancy type, because every metric flows from those two inputs. Then decide whether a calculation will do or whether the building’s complexity demands simulation. For anything with destination dispatch, multiple zones or mixed use, choose simulation.
For a deeper walk through the metrics and how AdSimulo produces them, see the full lift traffic analysis service page, which links to worked examples and the underlying science.
What is the difference between lift traffic analysis and elevator traffic analysis?
None. “Lift” is the British term and “elevator” the American one for the same equipment, so the two phrases describe an identical process. UK and European practice tends to say lift traffic analysis; North American practice says elevator traffic analysis.
When in a project should traffic analysis be done?
At concept and scheme design, before the lift core is fixed. The whole point is to influence the number and size of shafts while changing them is still inexpensive. A second pass is common at detailed design to confirm the final specification.
Do I need simulation or is calculation enough?
Calculation suffices for a simple up-peak in a conventional building. Simulation is necessary whenever the building uses destination dispatch, has sky lobbies or mixed tenancy, or where two-way and interfloor traffic materially affect the result.
What is a good average waiting time?
It depends on building grade. A high-quality office commonly targets an average waiting time below 20 to 25 seconds during the up-peak, while residential and budget commercial buildings accept longer. The target is set against the standard of service the client is paying for.
We use cookies to improve your experience on our site. By using our site, you consent to cookies.
Cookie Preferences
Manage your cookie preferences below:
Essential cookies enable basic functions and are necessary for the proper function of the website.
Name
Description
Duration
Cookie Preferences
This cookie is used to store the user's cookie consent preferences.
30 days
Cookie Preferences
This cookie is used to store the user's cookie consent preferences.
30 days
Google reCAPTCHA helps protect websites from spam and abuse by verifying user interactions through challenges.
Name
Description
Duration
_GRECAPTCHA
Google reCAPTCHA sets a necessary cookie (_GRECAPTCHA) when executed for the purpose of providing its risk analysis.
179 days
Google Tag Manager simplifies the management of marketing tags on your website without code changes.
Name
Description
Duration
td
Registers statistical data on users' behaviour on the website. Used for internal analytics by the website operator.
session
cookiePreferences
Registers cookie preferences of a user
2 years
Statistics cookies collect information anonymously. This information helps us understand how visitors use our website.
SourceBuster is used by WooCommerce for order attribution based on user source.
Name
Description
Duration
sbjs_session
The number of page views in this session and the current page path
30 minutes
sbjs_udata
Information about the visitor’s user agent, such as IP, the browser, and the device type
session
sbjs_first
Traffic origin information for the visitor’s first visit to your store (only applicable if the visitor returns before the session expires)
session
sbjs_current
Traffic origin information for the visitor’s current visit to your store
session
sbjs_first_add
Timestamp, referring URL, and entry page for your visitor’s first visit to your store (only applicable if the visitor returns before the session expires)
session
sbjs_current_add
Timestamp, referring URL, and entry page for your visitor’s current visit to your store
session
sbjs_migrations
Technical data to help with migrations between different versions of the tracking feature
session
Marketing cookies are used to follow visitors to websites. The intention is to show ads that are relevant and engaging to the individual user.
Facebook Pixel is a web analytics service that tracks and reports website traffic.